345 Strategies

Tools for traders and investors smart enough to keep it simple.

Principles

  1. 1

    Clarity over complexity.

    Every tool here exists to take something off your chart, not add to it. If an indicator needs a manual to read, it's hiding confusion behind complexity. We'd rather show you less, clearly.

  2. 2

    Structure, not gimmicks.

    Everything runs on repeatable, structural rules for how price actually moves: bar types, timeframe continuity, the levels that matter. No secret sauce, no curve fitting, nothing that only works in a backtest.

  3. 3

    Open by default.

    Every indicator here is free, and the code is public. Read it, fork it, check the math. If you can't see how a tool works, you shouldn't trust it with your money.

Dept. 1

Indicators

All four run on TradingView, and all four are free and open source. TheStrat Suite is also in beta testing on thinkorswim and NinjaTrader 8.

Available on:

  • 3½" floppy disk Sold out
  • CD-ROM Sold out
  • TradingView In stock
  • GitHub In stock
  • thinkorswim Suite beta
  • NinjaTrader 8 Suite beta

No. 1.1 TradingView

TheStrat Suite: Entries, targets and stop loss

Rob Smith's TheStrat on six timeframes at once. Every bar classified, with targets on the chart and stops when you want them.

Answers What's the setup on all six timeframes?

It started as a paid indicator. Now the whole thing is free and open source: a complete rule-based trading system for the Strat, with analysis, markup and alerts across six timeframes on one chart.

Specifications

Timeframes
Six on one chart. Presets for TheStrat Classic, Scalp, Day Trade, Futures/Crypto, Swing Trade and Investing, or set your own.
Signals
Bar types, signals with magnitude and exhaustion targets, Full Timeframe Continuity, stop levels and Dominoes
Alerts
Consolidated alerts and a live multi-timeframe table
Platforms
TradingView today. Versions for thinkorswim and NinjaTrader 8 are in beta testing, free for testers to try.
Repaint
None. What you saw live is what a reload shows.
Source
Pine Script v6, free and open source under the Mozilla Public License 2.0
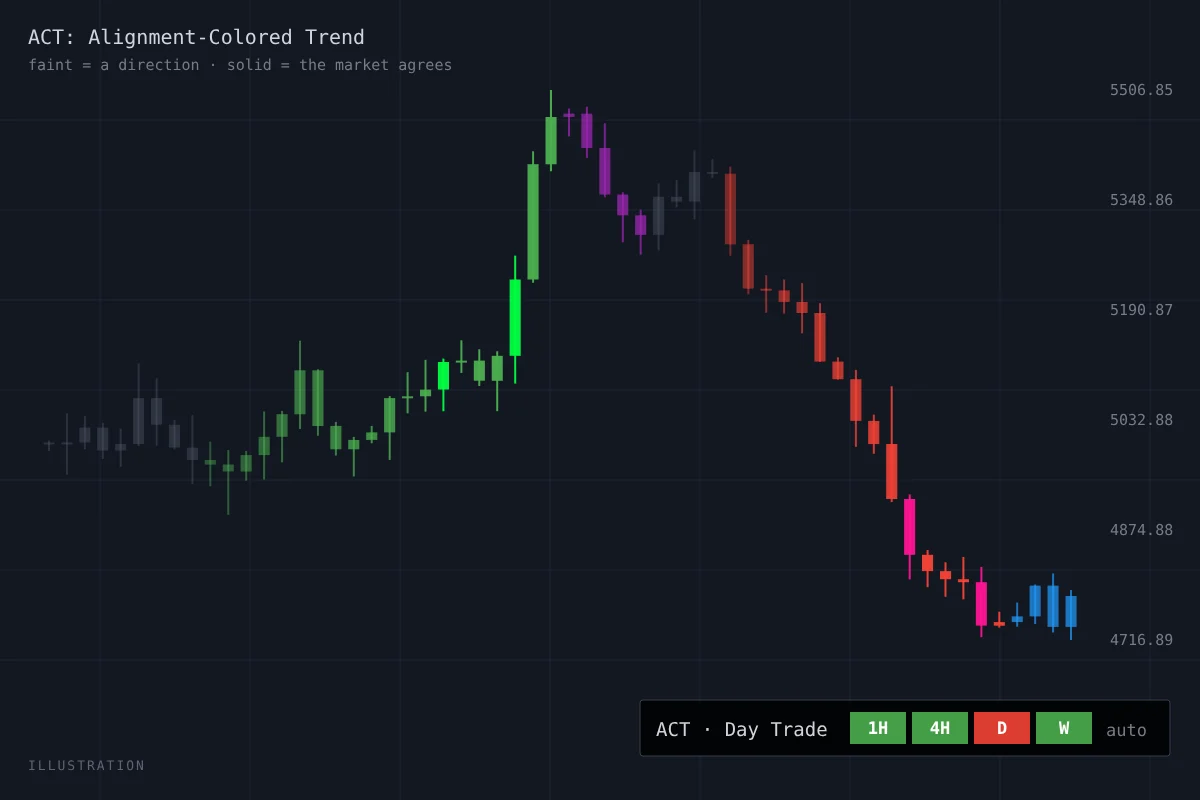
Illustration of ACT on a candlestick chart: faint candles carry a direction, solid candles have the market agreeing, and a panel shows the Day Trade ladder of 1H, 4H, D and W

No. 1.2 TradingView

New: ACT: Alignment-Colored Trend

Answers How much of the market agrees with this candle?

A faint candle has a direction and little behind it. A solid one has its higher timeframes and sister indexes breaking the same way.

A 15-minute ES futures chart with round SPX levels drawn as blue lines, shifted up by the fair value premium

No. 1.3 TradingView

SPX Psych Levels + Fair Value

Answers Where is gamma likely heaviest on my ES or SPY chart?

Open interest clusters at round SPX strikes, so gamma tends to be heaviest there. This estimates those levels from the strikes, not options data, and draws them on ES, MES and SPY.

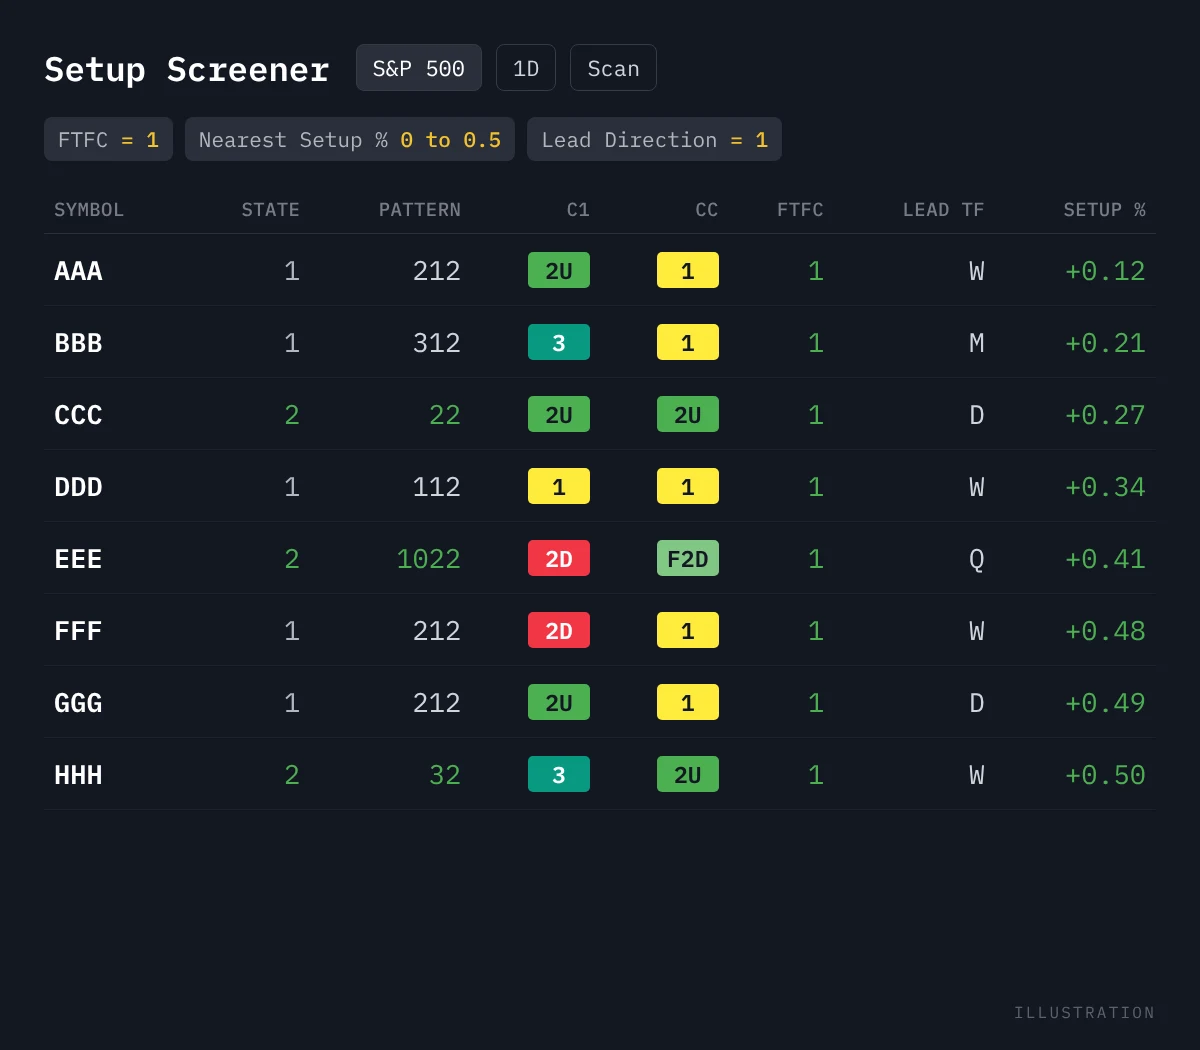
Illustration of a Pine Screener scan of the S&P 500 on the daily: rows of symbols with their Strat state, pattern code, trigger and current candle types, Full Timeframe Continuity, Lead timeframe and distance to the nearest setup

No. 1.4 TradingView Pine Screener

New: TheStrat Setup Screener

Answers Which symbols have a setup right now?

TheStrat Suite's signal engine, turned into screener columns. Scan a watchlist or a whole index for Full Timeframe Continuity, 2-1-2s, failing 2s, Dominoes and setups about to trigger.

Specifications

Columns
State, pattern, C2, C1 and CC candle types, FTFC, the Lead, and state for each of six timeframes
Filters
Named candle filters, like CC: 2D green, C1: hammer and CC: F2U
Requires
TradingView Pine Screener, Premium plan or higher

Dept. 2

API

A Price Action API JSON response showing bar states and timeframe continuity for SPY

No. 2.1 For developers

Price Action API

Objective price action data, delivered as an API.

Specifications

Bars
Every bar classified into a state
Continuity
Computed across timeframes on every request
Response
JSON
Built for
Bots, agents and dashboards

Dept. 3

Research and backtesting

Read the deep dive. The code that labels its bars is open source: check the numbers, or build your own backtests on top of it.

Special reportNo. 3.1 Strat Stats: ES and NQ futures, 2018-2026

The combo label alone barely beats a random break.

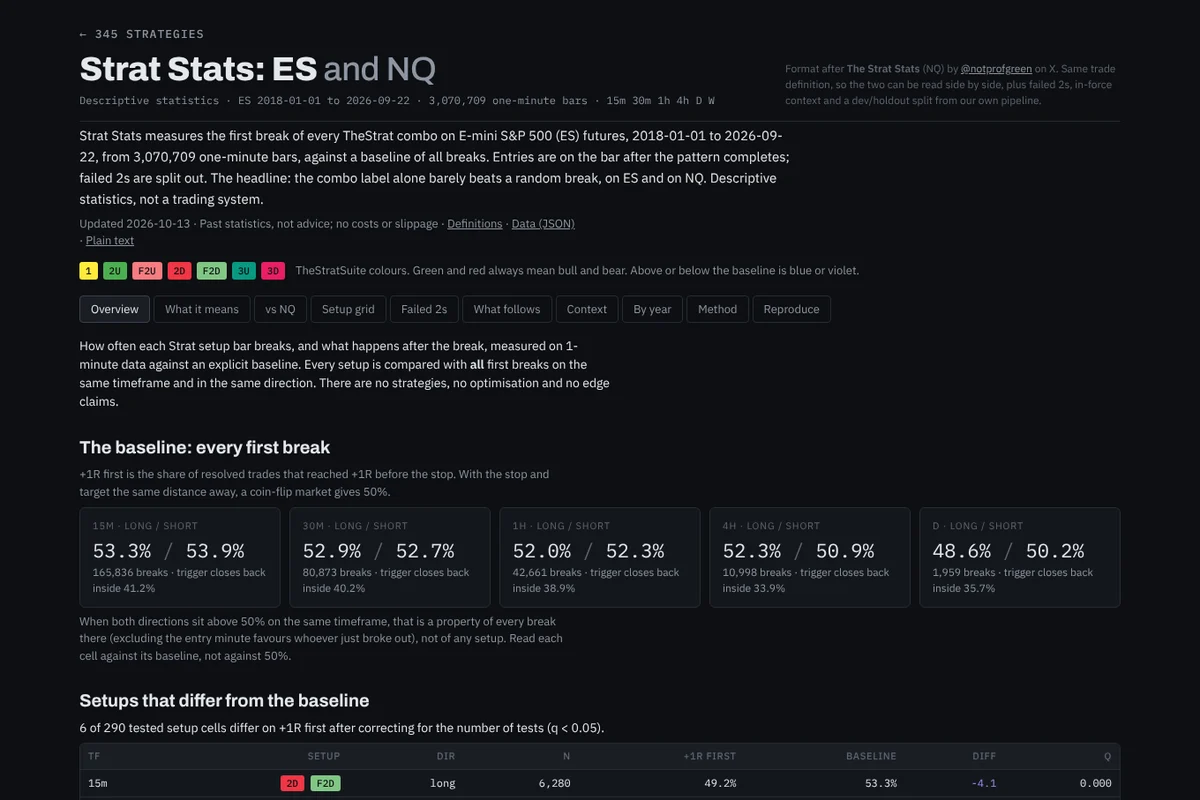
That holds on ES and on NQ. Strat Stats measures the first break of every TheStrat combo on E-mini S&P 500 futures, against a baseline of all breaks, with failed 2s split out and a replication of @notprofgreen's NQ study.

The Strat Stats page: baseline first-break rates for ES on each timeframe from 15m to daily, and the start of a table of setups that differ from the baseline
3,070,7091-minute bars of ES futures
2018-2026Jan 1, 2018 to Sep 22, 2026
290setup cells tested against their baseline
6differ from their baseline after correcting for multiple tests (q < 0.05); 4 of the 6 do worse

Descriptive statistics, not a trading system. Past statistics, not advice.

Also in Dept. 3: open-source tools

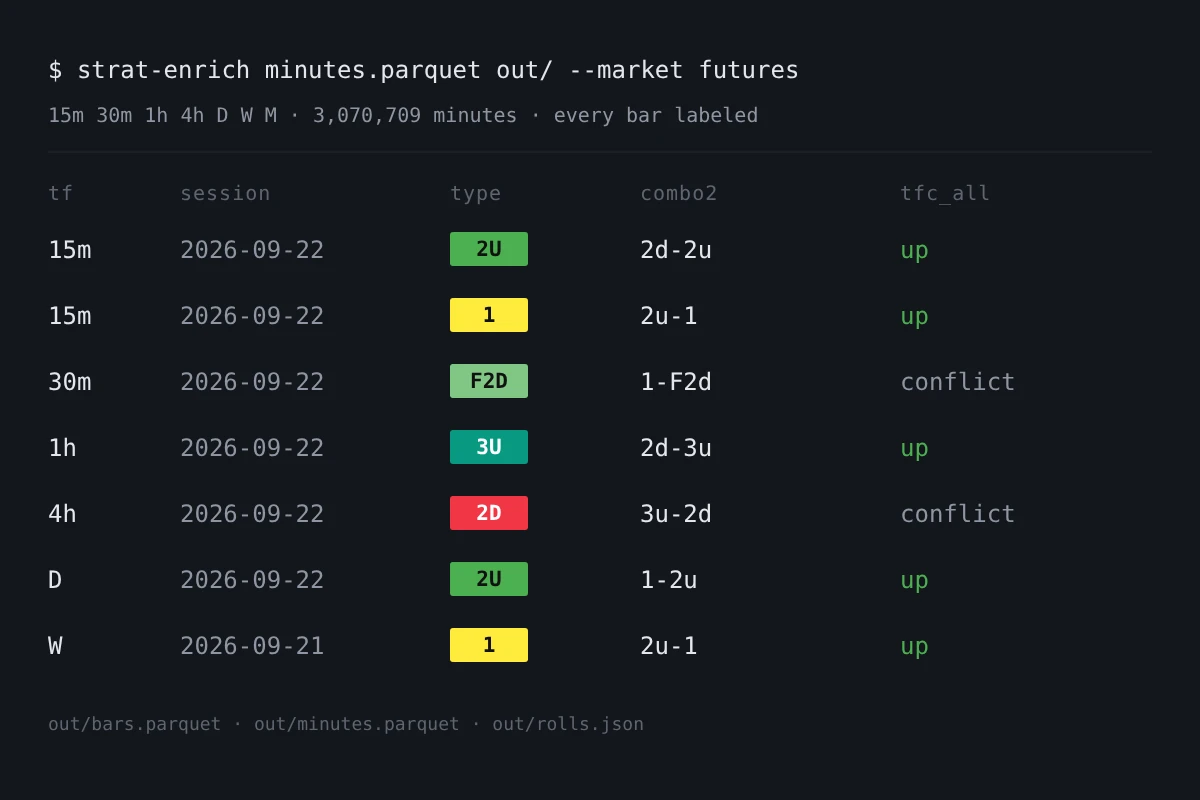
Terminal output from strat-enrich: the latest 15m to weekly bars as of 2026-09-22, each labeled with its bar type, combo and timeframe continuity

No. 3.2 Python

strat-enrichment

The code that labels every bar behind Strat Stats. It rebuilds TheStrat bar states from 1-minute bars on every timeframe, 15m to monthly, each with its type, combos and timeframe continuity. Bring your own 1-minute data. It labels bars. What you do with the labels is up to you.

strat-enrich minutes.parquet out/ --market futures

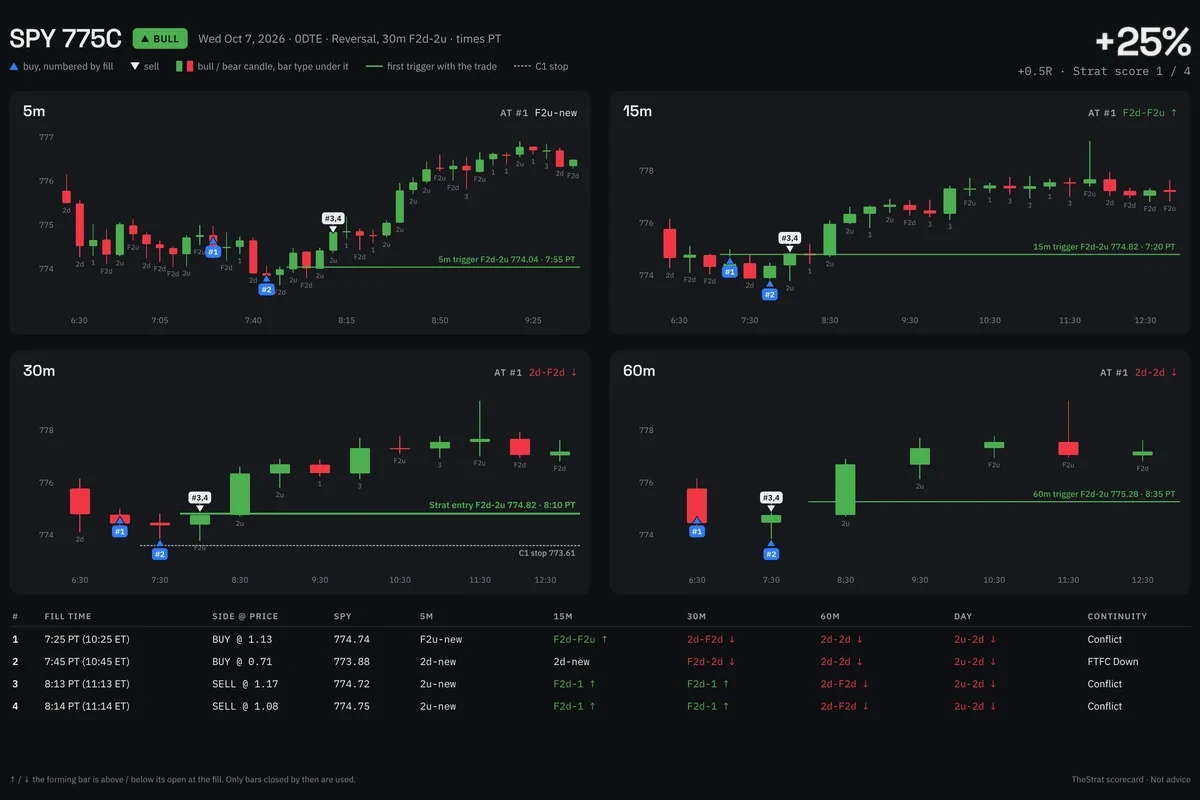
TheStrat Trade Review of a day of SPY 0DTE calls: 5m, 15m, 30m and 60m charts with numbered fills and a table of each fill

No. 3.3 Claude/ChatGPT skill

TheStrat Trade Review

Hand it your fills from any broker. It shows where each entry sat on the 5m, 15m, 30m and 60m bars, whether you traded with continuity, and what the clean trigger entry would have paid. Options, shares and futures.

/strat-review SPY today

About

Make trading as simple as three, four, five!

I learned to trade through TheStrat, the method created and taught by Rob Smith. His big idea was a universal language for the market: every bar is a 1, a 2, or a 3.

That language is my foundation. These tools pick up where it leaves off, and keep counting.

345 Strategies is the work of Nate King, a trader, product marketer and strategist based in the Bay Area.